

KB 103 (Splunk): PowerConnect Splunk App – Process Chain Dashboard Guide
Category: Information
Platform: Splunk
Priority: Normal
Version: 1 from 23.03.2021
Description
The guide below provides instructions on how to configure the process chain dashboard in the PowerConnect Splunkbase application. Please follow the steps below for how to complete the setup.
Saved Searches
The following saved searches are used to populate the lookups. By default these searches are disabled. Users need to manually enable them
-
Sap_Subchain_Hour_Relation
-
sap_state_step_chain – Lookup Gen
-
sap_state_step_chain – Lookup Gen (Month Reset)
-
Avg_Process_Chain
-
Avg_Process_Chain2
-
Next_Start_Process_Chain
-
Sap_Process_Chain_Status_Duration
-
sub_subchain_hour_relation_lookup – Lookup Gen
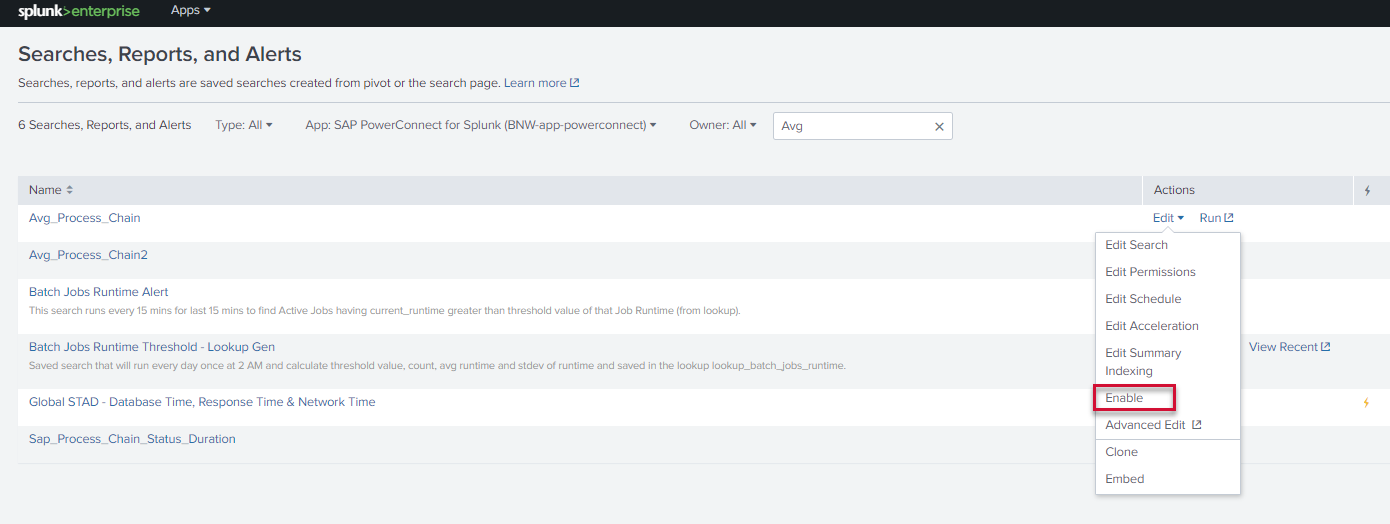
The steps to enable the savedsearches are:
-
On Splunk’s menu bar, Click on Settings -> Searches, reports, and alerts.
-
Select SAP Powerconnect for Splunk (BNW-app-powerconnect) in App.
-
Click on “Edit” dropdown under “Actions” and click on “Enable”.
You should be able to visit the new dashboard by going to the following URL:
http://<your_splunk_instance_address>/en-US/app/BNW-app-powerconnect/process_cha in_dashboard
*(Replace the placeholder in the URL)
Product version
|
Product |
From |
To |
|
PowerConnect [NW,S4HANA,S4HANA Cloud] |
[Affected version from] |
[Affected version to] |