
|
Category: Problem |
Priority: Normal |
|---|---|
|
Platform: Splunk (App Version: 7.0.0) |
Version: 1 from 03.08.2022 |
Description
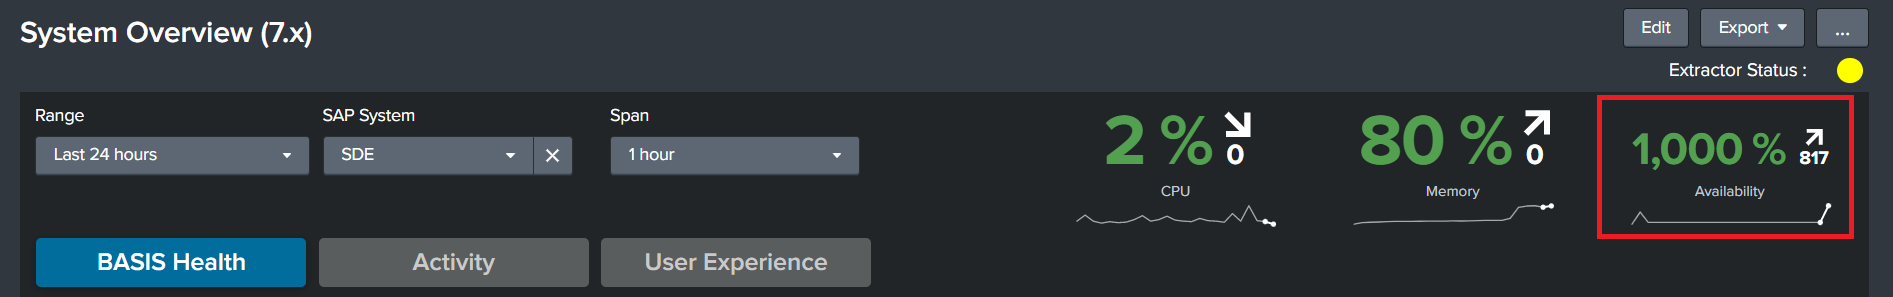
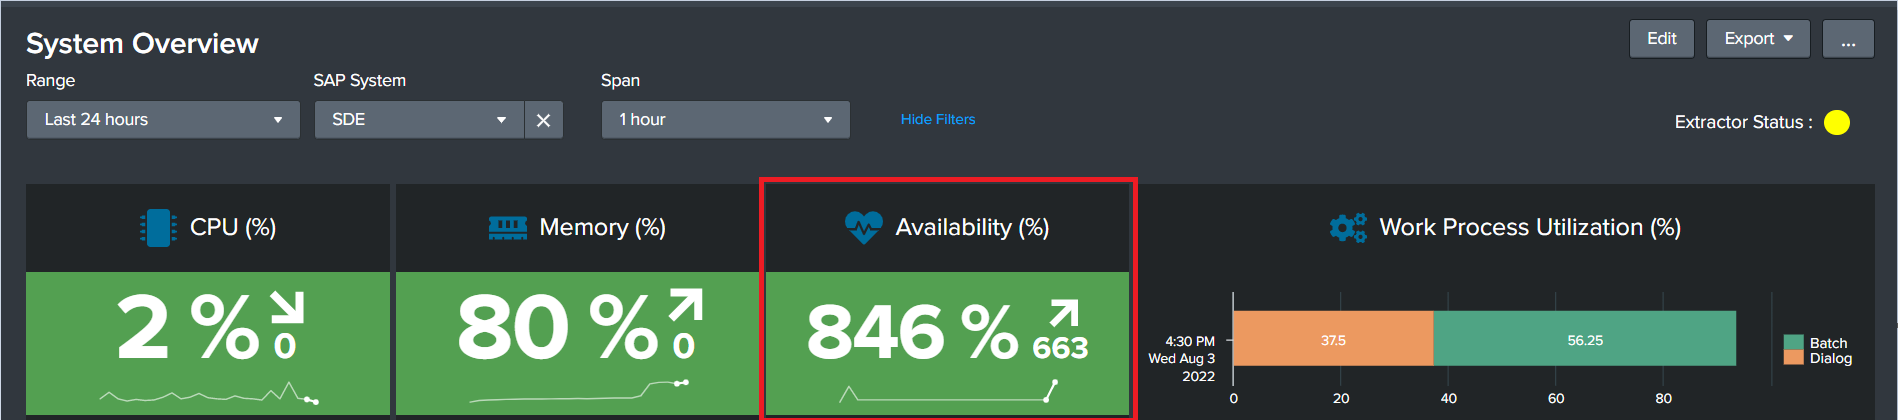
An issue was noted in the Availability panel from the Splunk app’s System Overview dashboards. They may show a value above 100%.
Cause
The underlying query for the Availability metric is not populating the correct information.
Resolution
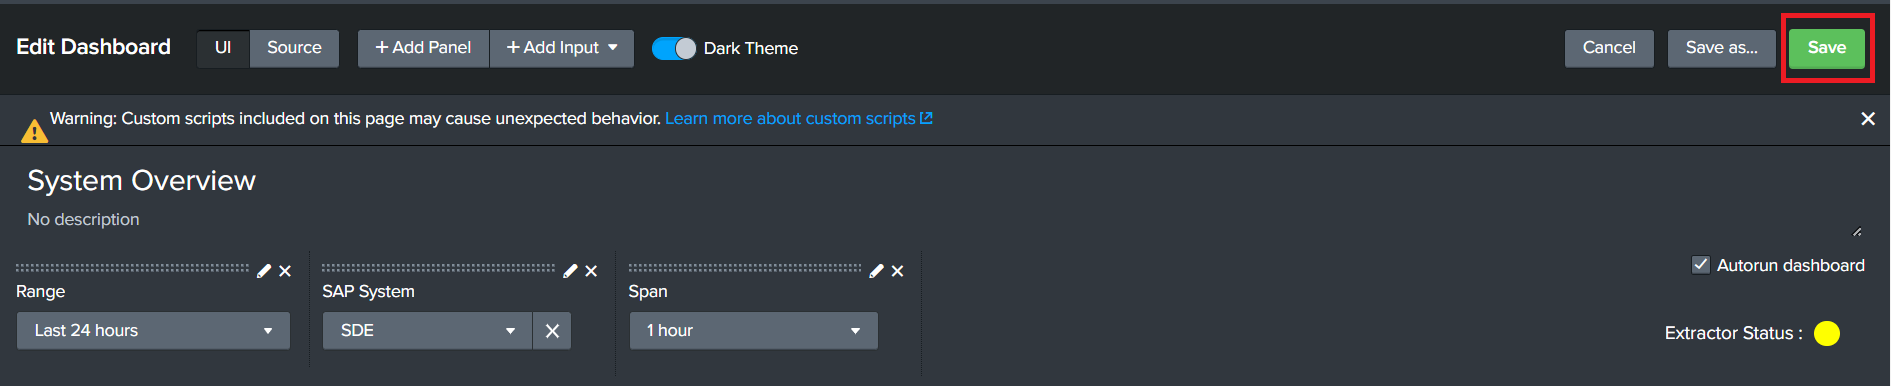
For either dashboard, click the Edit button at the top right corner.

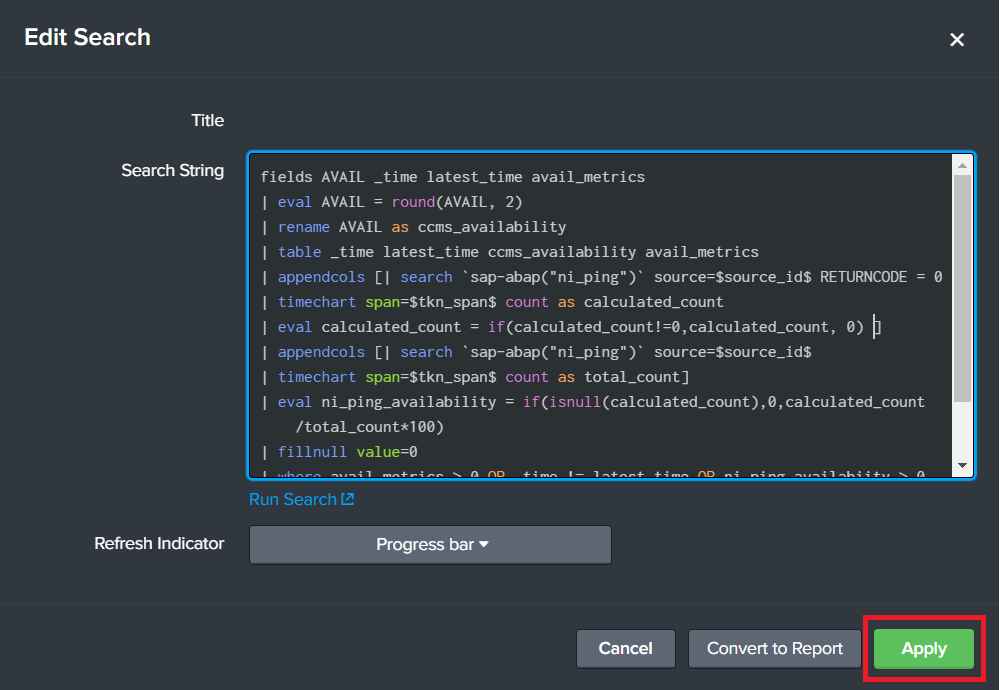
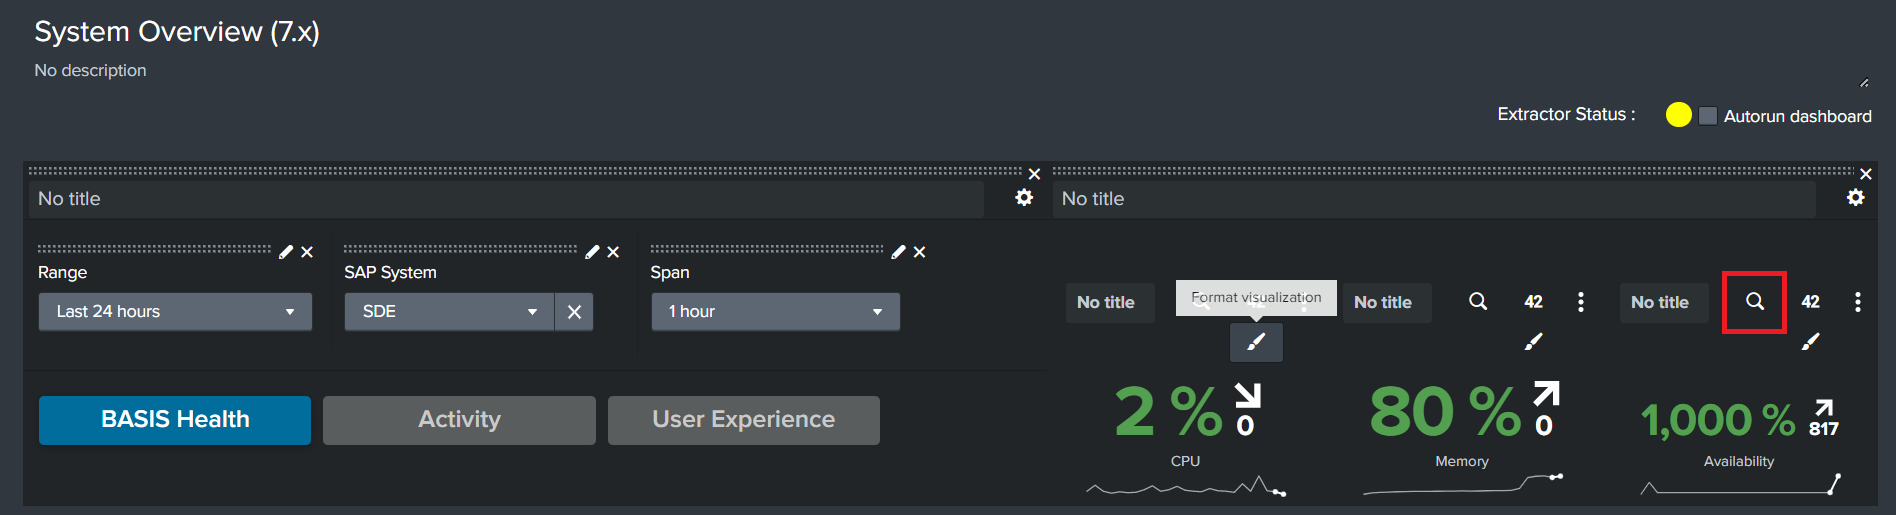
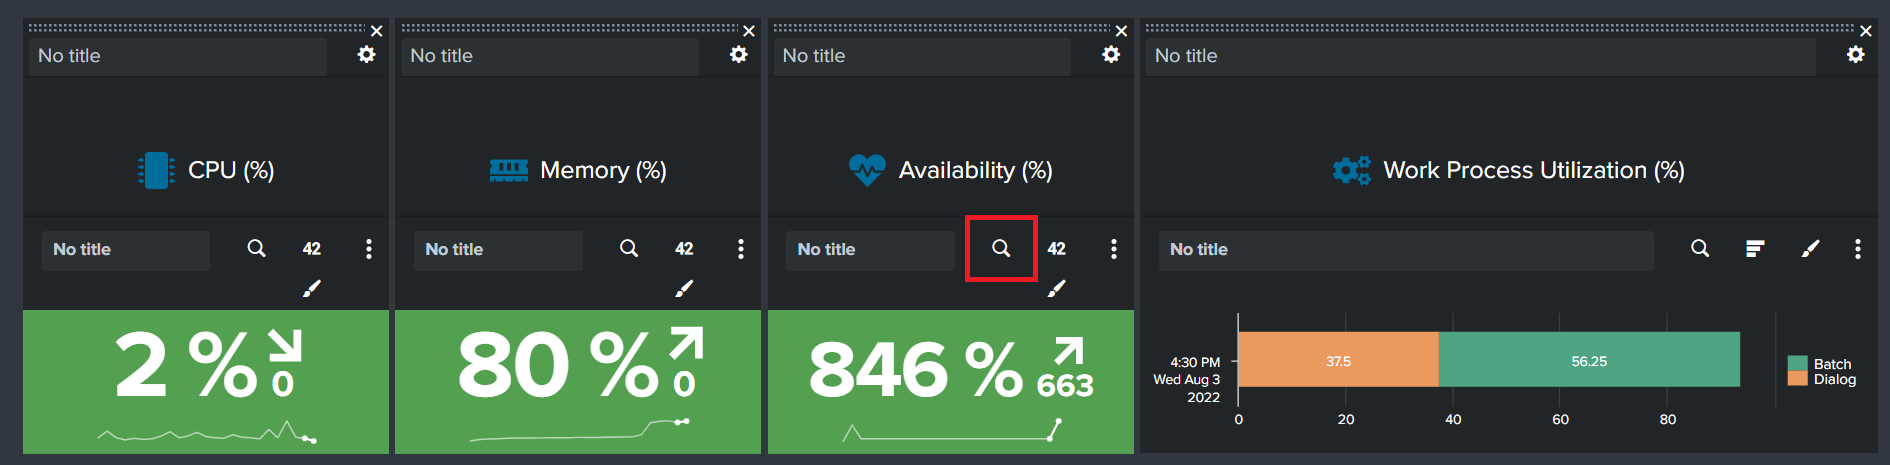
Click the “Edit Search” magnifying glass icon for the Availability search panel.
-
For the System Overview (7.x) dashboard, the Availability panel will be in the top right corner of the dashboard next to the input options.
-
For the legacy System Overview dashboard, the Availability panel is in the center of the first panel row.
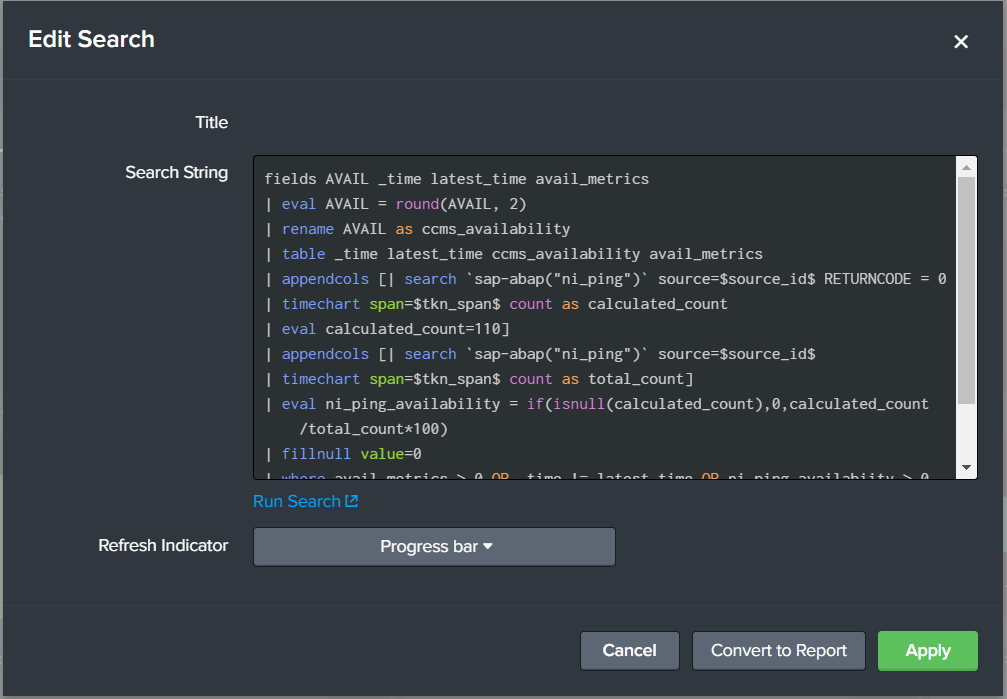
Replace the existing value of “110” with “if(calculated_count!=0,calculated_count, 0)” on the eval line for the calculated_count field.
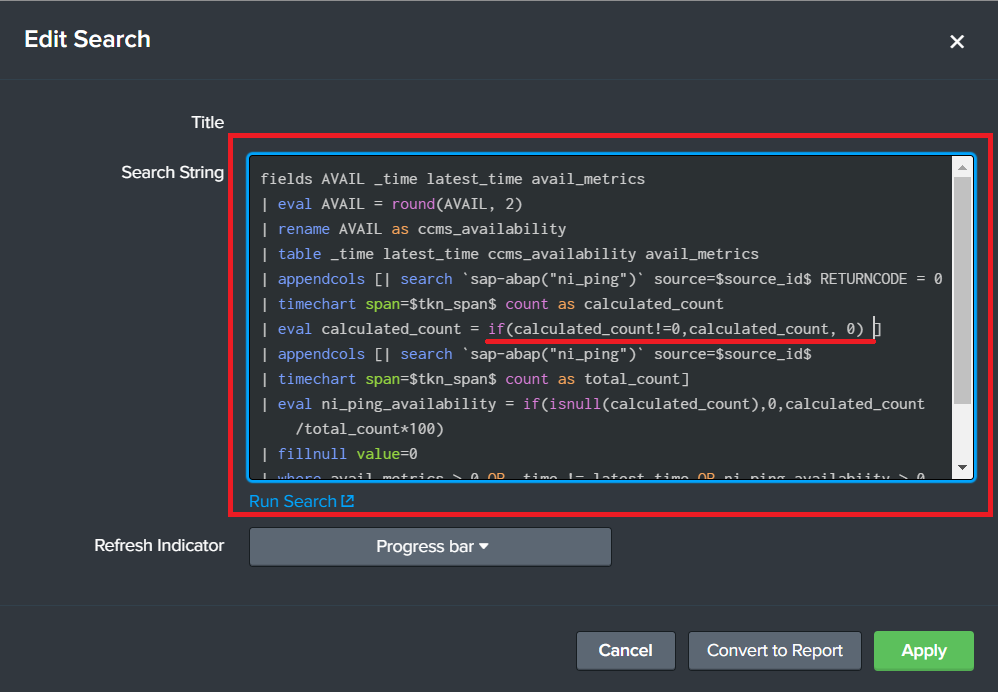
Click “Apply” for the “Edit Search” box, and then click the “Save” button at the top right to save the dashboard.