

Adding a Dynatrace Log Monitoring API output
-
Login to the PowerConnect Cloud web UI
-
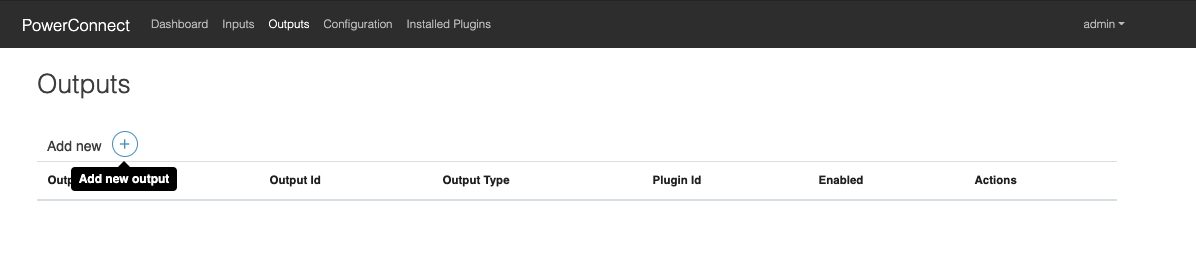
Click the Outputs link in the menu bar
-
Click the + button to add a new output
-
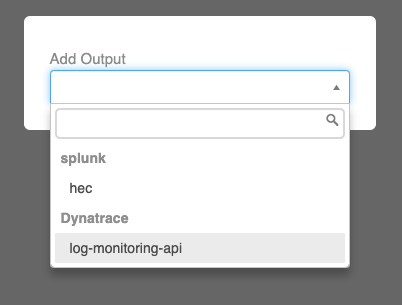
Choose log-monitoring-api under the Dynatrace heading in the dropdown menu that appears
-
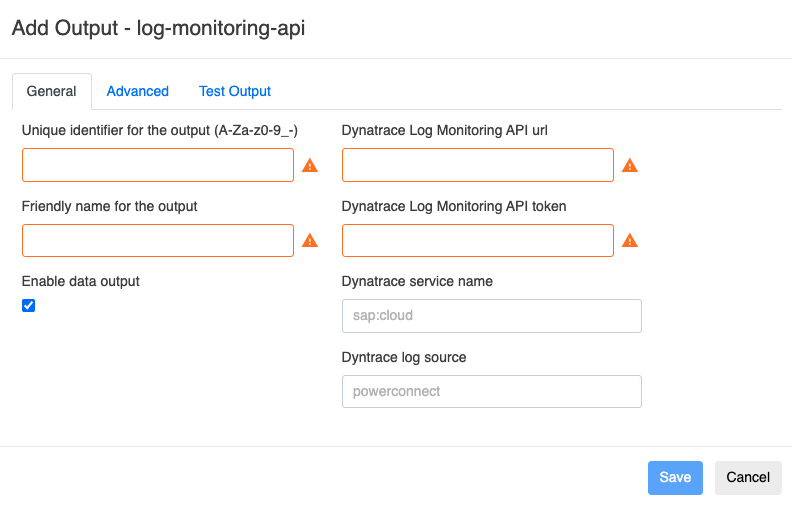
Populate the form with the details of your Dynatrace Log Monitoring API endpoint
|
Configuration |
Description |
Required |
Default Value |
Comments |
|---|---|---|---|---|
|
Dynatrace Log Monitoring API URL |
Log Monitoring API url |
Yes |
|
|
|
Dynatrace Log Monitoring API Token |
Log Monitoring API token |
Yes |
|
|
|
Dynatrace service name |
Dynatrace Service field value |
No |
sap:cloud |
|
|
Dynatrace log lource |
Dynatrace source field value |
No |
powerconnect |
This value is overridden by the System ID value of the Inputs |
|
Batch events together before sending to Dynatrace |
Batch events |
No |
Yes |
|
|
Batch size |
Max size of the batches |
No |
100 |
|
|
Retry send if error occurs |
Retry sending data if the Dynatrace endpoint is down |
No |
No |
|
|
Number of times to retry |
If retries are enabled defines how many times the Agent will retry before giving up |
No |
3 |
|
|
Backoff interval in seconds (fixed) |
Time in seconds the Agent will wait between retries |
No |
10 |
|
-
Click the Save button
-
The output has now been created