

Adding an Observability Cloud Traces output
-
Login to the PowerConnect Cloud web UI
-
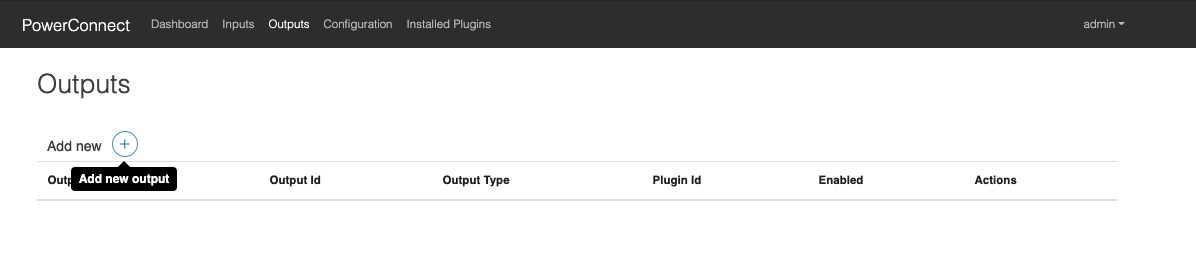
Click the Outputs link in the menu bar
-
Click the + button to add a new output
-
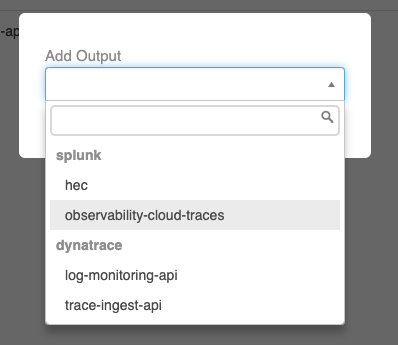
Choose splunk → observability-cloud-trace in the dropdown menu that appears
-
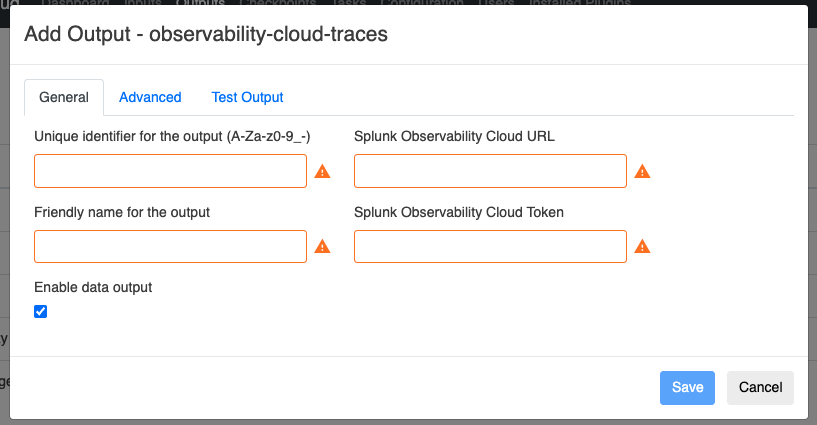
Populate the form with the details of your Splunk Observability Cloud Traces API endpoint
|
Configuration |
Description |
Required |
Default Value |
Comments |
|---|---|---|---|---|
|
Splunk Obervability Cloud Token |
Splunk Observability Cloud token |
Yes |
|
|
|
Splunk Obervability Cloud url |
Splunk Obervability Cloud url |
Yes |
|
This should be the trace API url of the Splunk Observability Cloud platform e.g. https://ingest.signalfx.com/v2/trace/otlp |
|
Batch |
Batch traces together before sending to Splunk |
No |
Yes |
|
|
Batch Size |
Max number of traces per batch |
No |
100 |
|
|
Retry |
Retry sending data if the Splunk endpoint is down |
No |
No |
|
|
Max Retries |
If retries are enabled defines how many times the Agent will retry before giving up |
No |
3 |
|
|
Retry Interval |
Time in milliseconds the Agent will wait between retries |
No |
10000 |
|
-
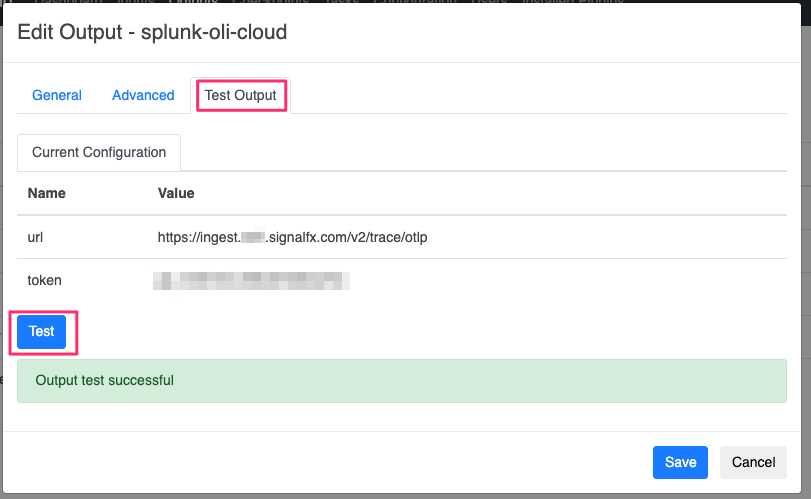
Click the Test Output tab then the Test button
-
Make sure the Output test is succssful, then click the Save button
-
The output has now been created