
Data Description
The PowerConnect application is able to extract data from over two thousand JMX Beans in the SAP system. These JMX Beans can be leveraged for SAP performance use cases.
Potential Use Cases
This event could be used in the following scenarios:
-
Count of heap memory dumps over time
-
Visualize system CPU architecture and Java version
-
Alert on garbage collection
PowerConnect Administrative Console Configuration
Important: None of the configurations below requires a restart of the PowerConnect agent.
There are two methods that can be used to configure the list of enabled JMX Beans in the PowerConnect Java application. Both methods are documented below:
Configuring via User Interface
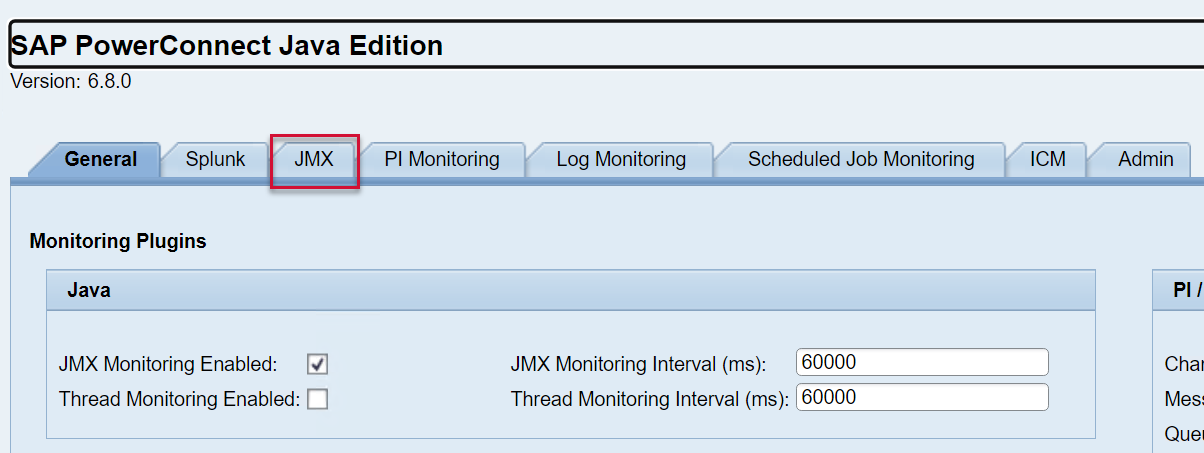
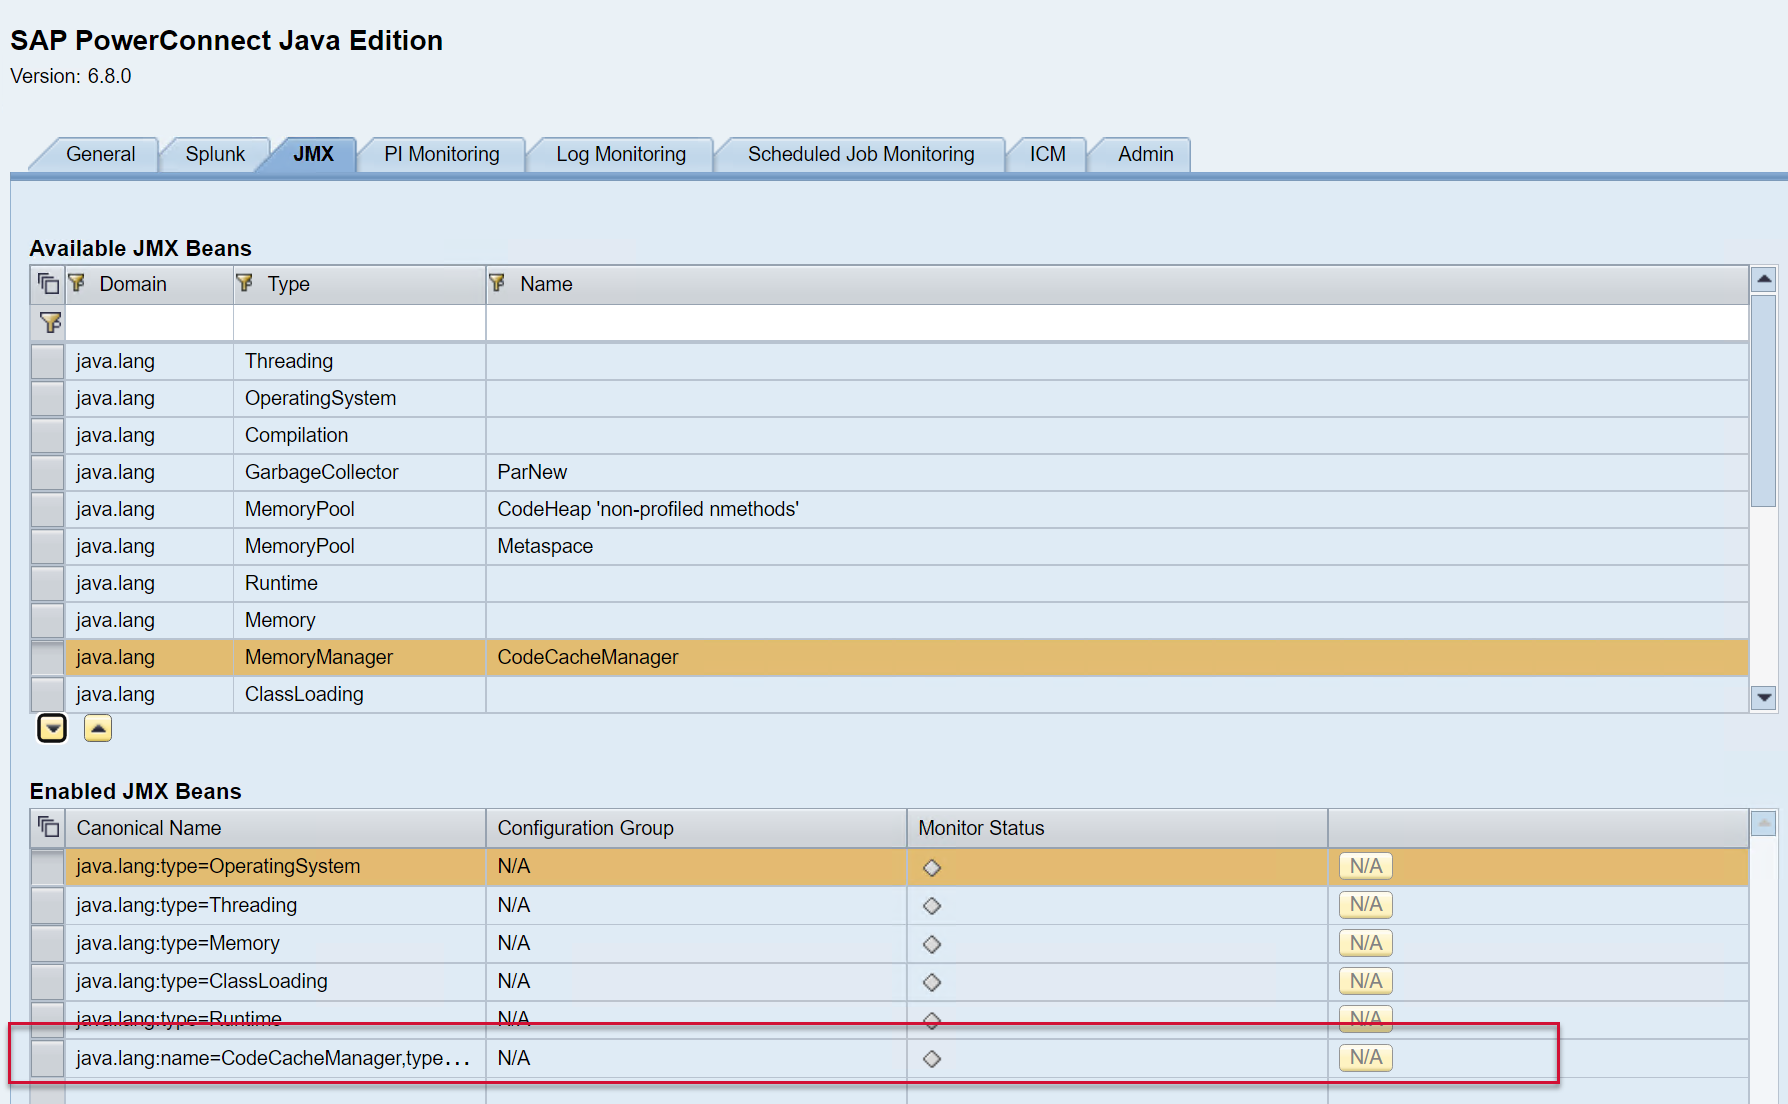
Log into the PowerConnect administrative console via the following URL (http://<serverhost>:<port>/webdynpro/resources/com.powerconnect5/spcj_wd/SapPowerConnectJava#). Then click on the JMX tab.
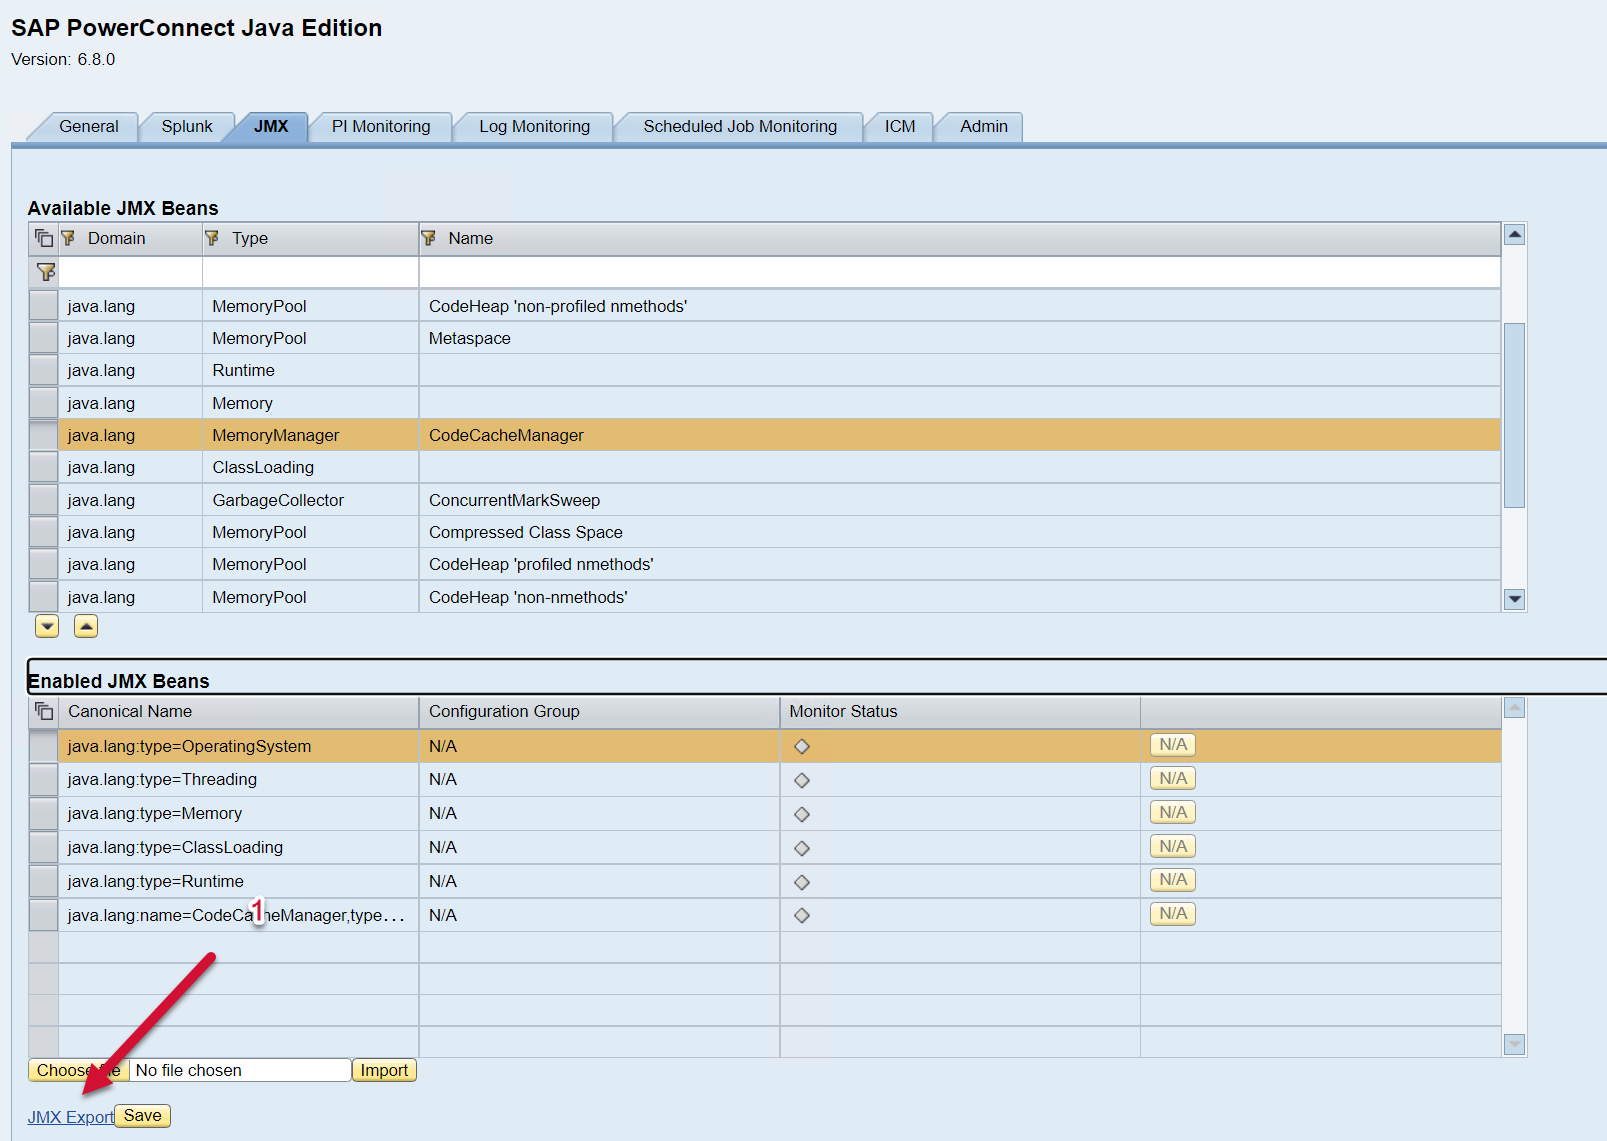
The list of available JMX Beans is displayed on the top half of the screen, and the bottom half of the screen shows the list of JMX Beans enabled.
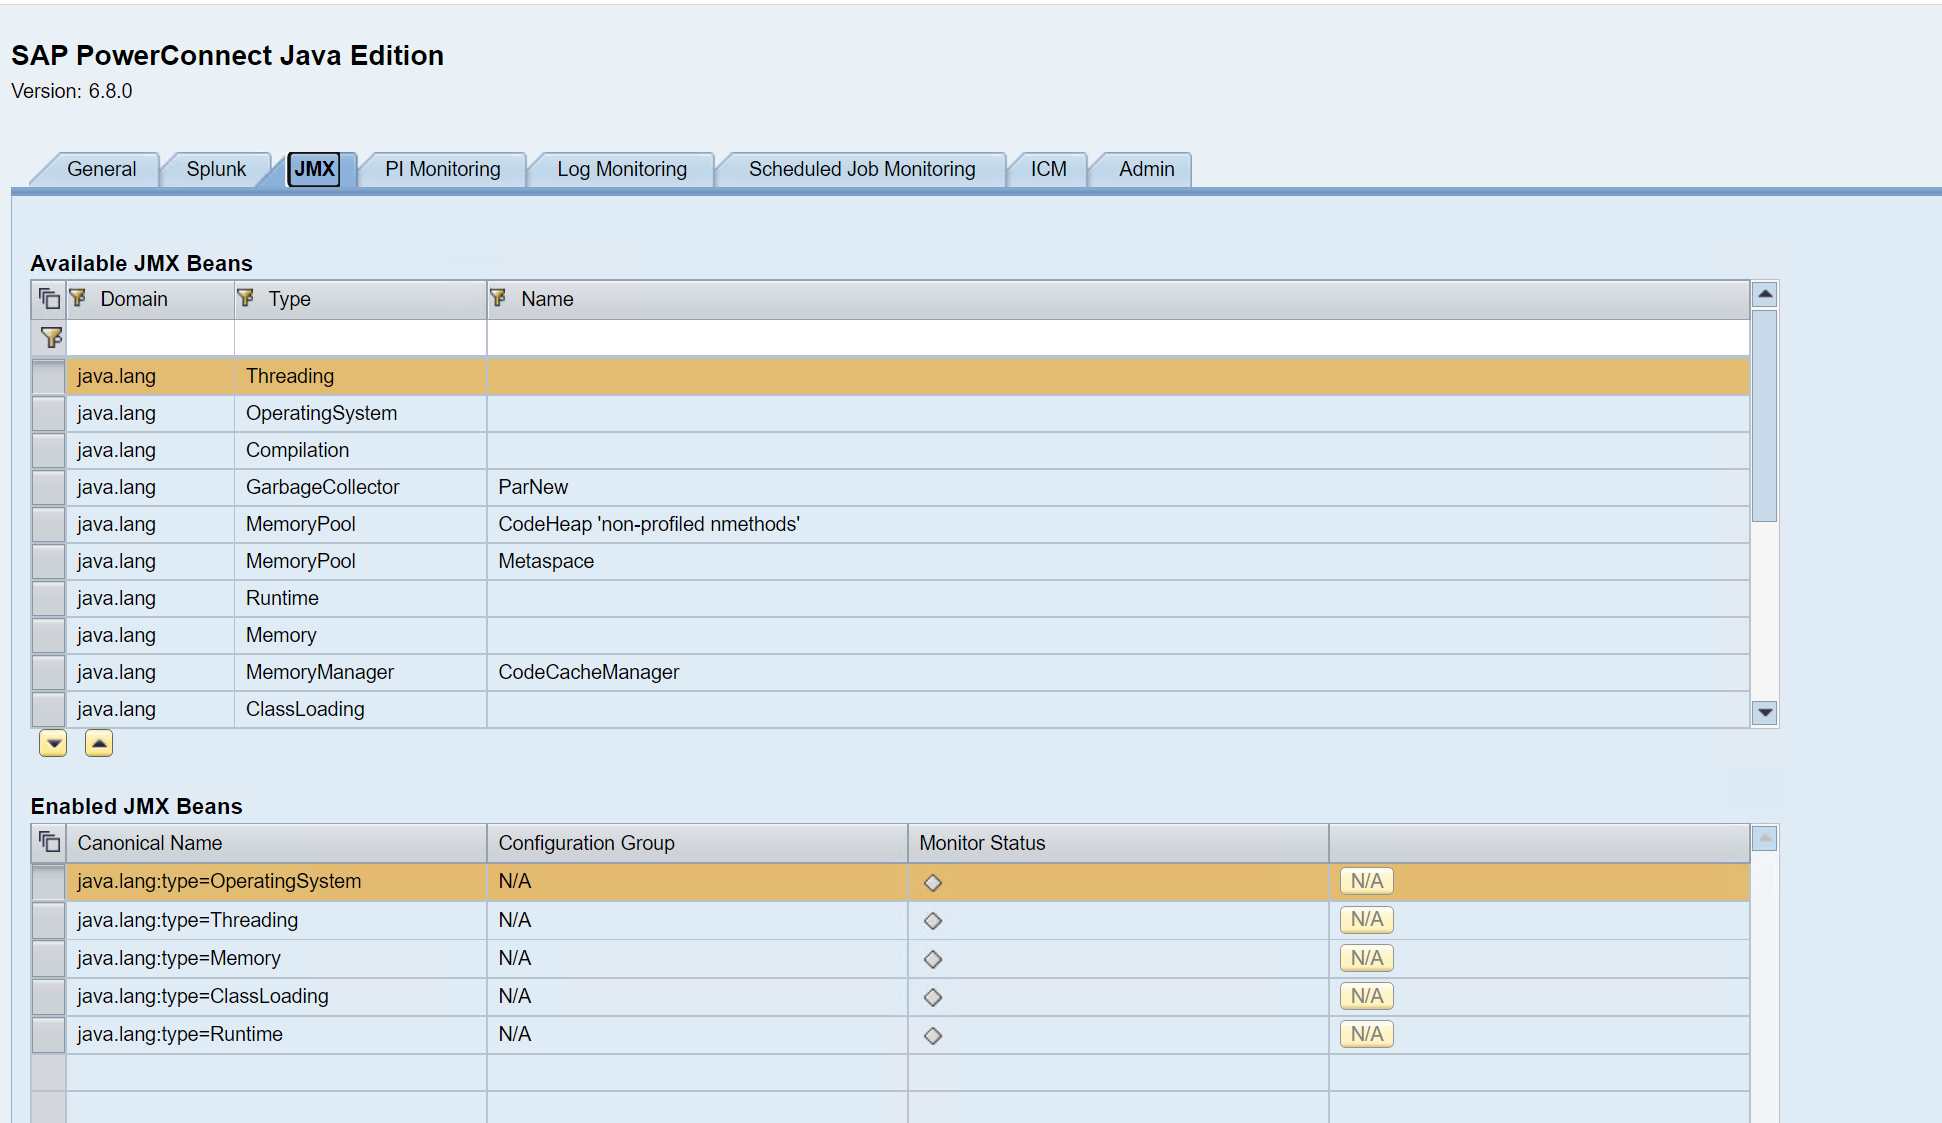
To enable a new JMX Bean, click on the JMX Bean of interest, and then add it to the list below using the arrow button.
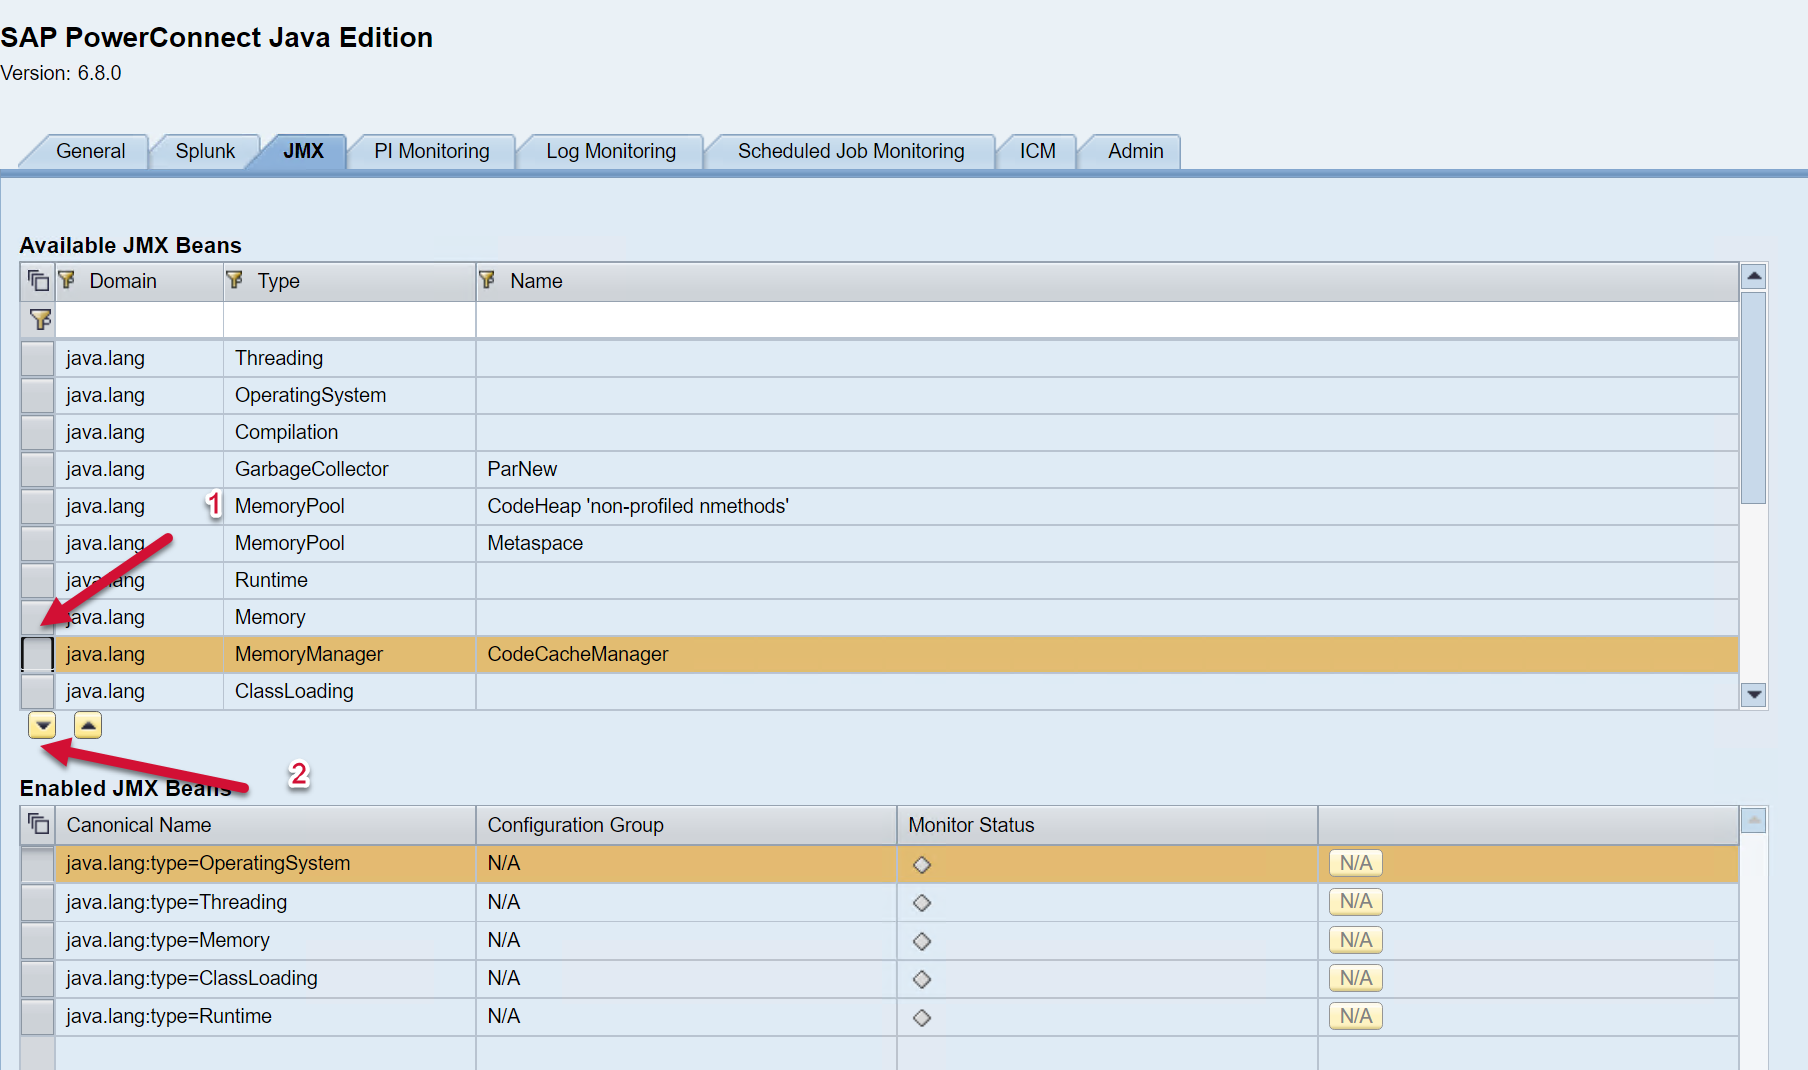
The JMX Beans will then be added to the list of Enabled JMX beans below.
Then Save using the button at the bottom of the screen.
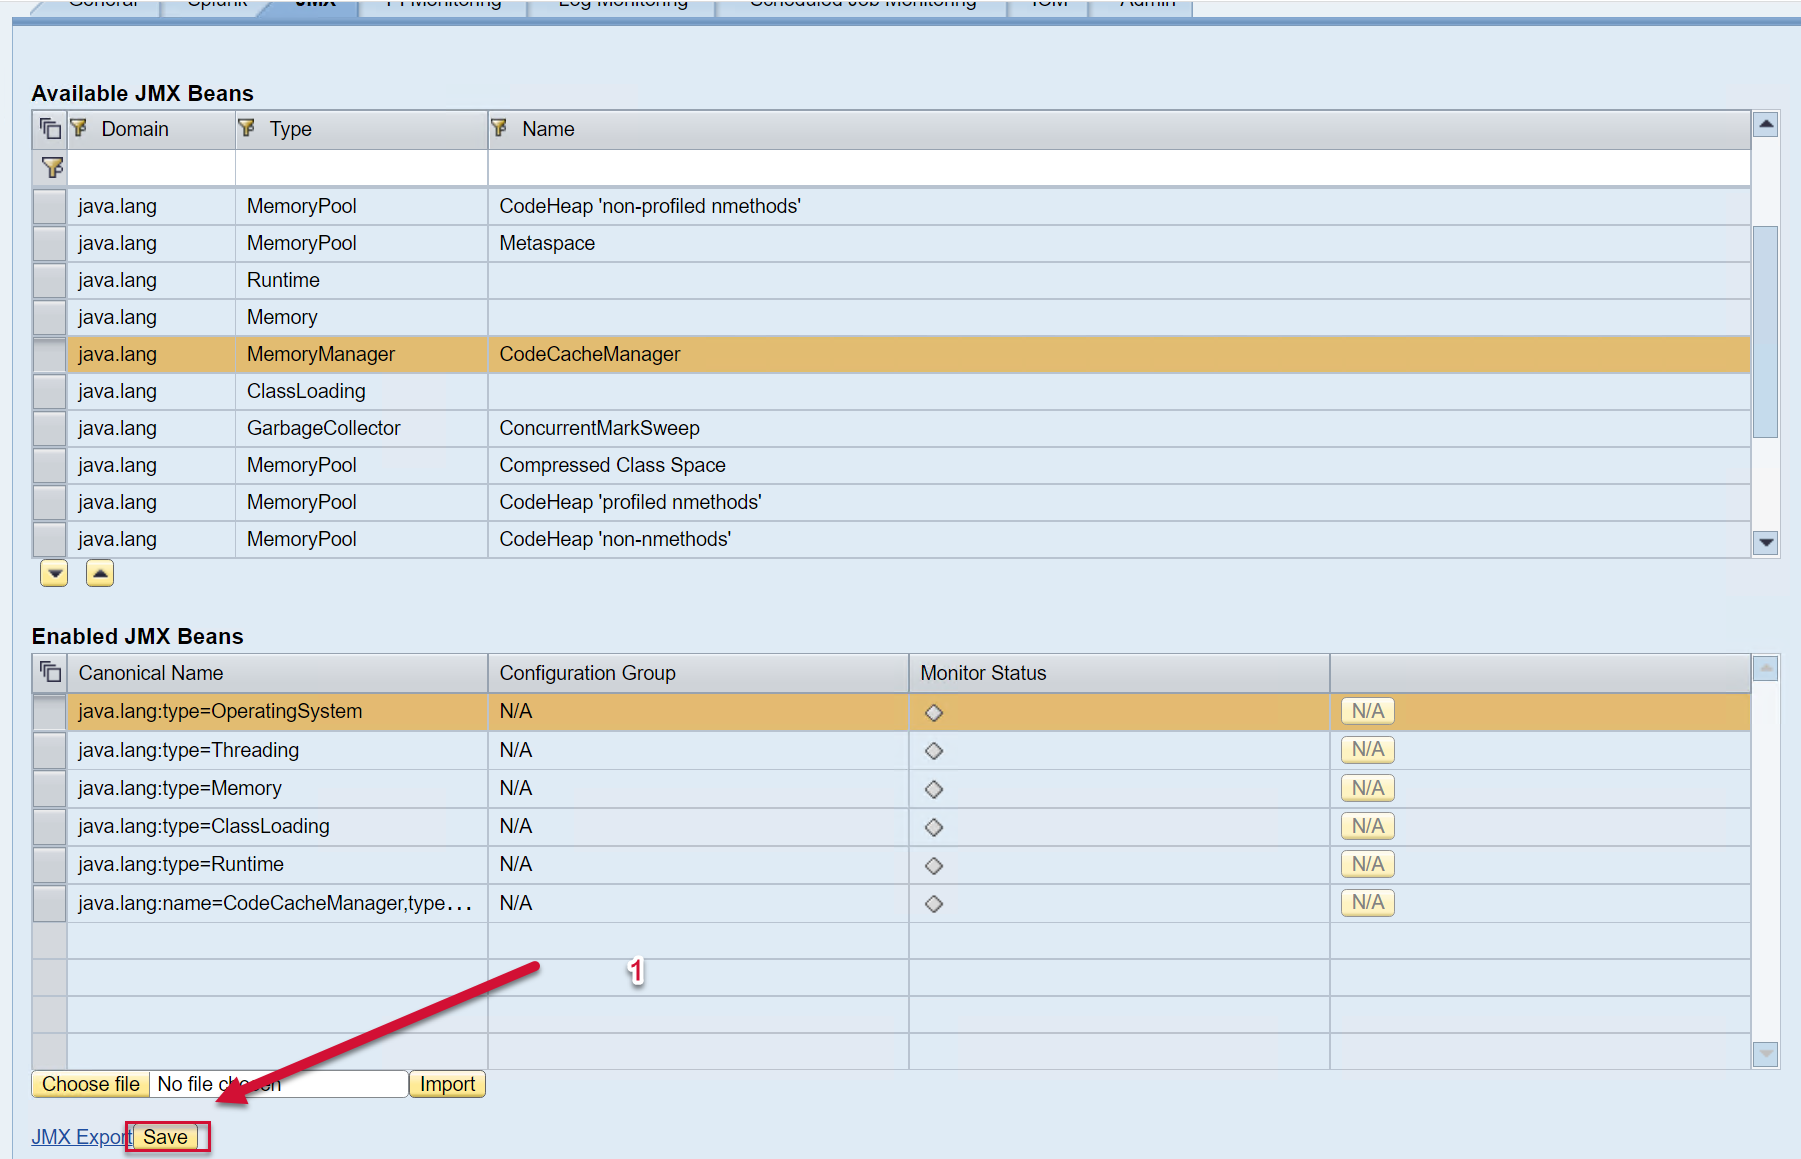
To disable a JMX Bean click on the respective line in the “Enabled JMX Beans” section and move it to the top. Save the configuration afterwards.
Configuring Using XML File
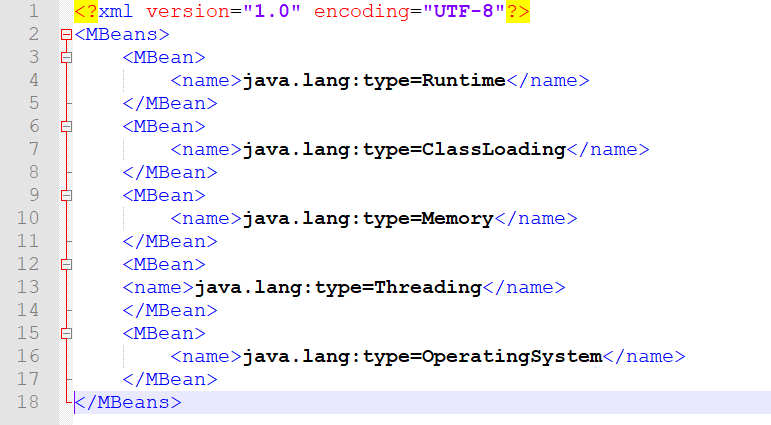
The enabled JMX Beans can also be exported and imported using an XML configuration file. The schema of the XML file is very simple – as an example:
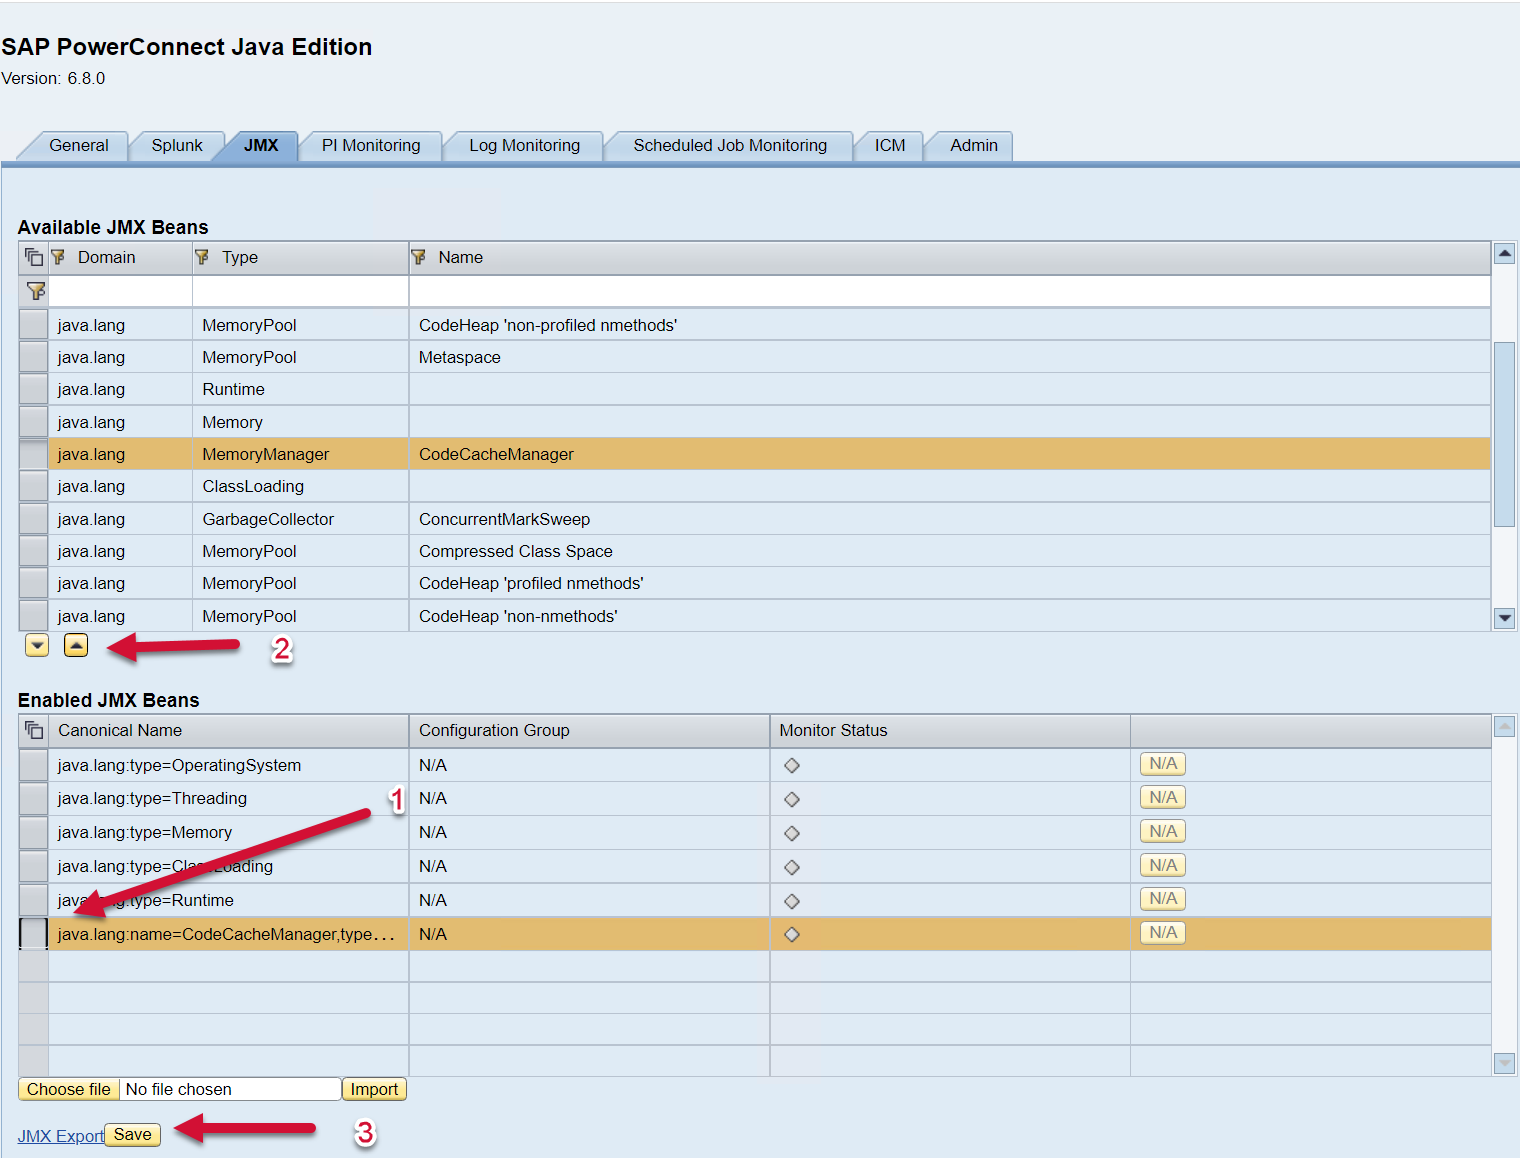
You can edit this file to include the JMX Beans that you would like to see in Splunk. To access the list of available JMX Beans and XML configuration, please log into the PowerConnect administrative console via the following URL (http://<serverhost>:<port>/webdynpro/resources/com.powerconnect5/spcj_wd/SapPowerConnectJava#). Then click on the JMX tab.
The list of available JMX Beans is displayed on the top half of the screen, and the bottom half of the screen shows the list of JMX Beans enabled. To export the JMX config click on the JMX Export button on the bottom of the screen.
Once the XML file has been exported, modify as desired. Once the XML file has been edited as desired, you can import the configuration by selecting the file using the “Choose file” button, find the XML file on your computer/server, and then select the Import button. Save.
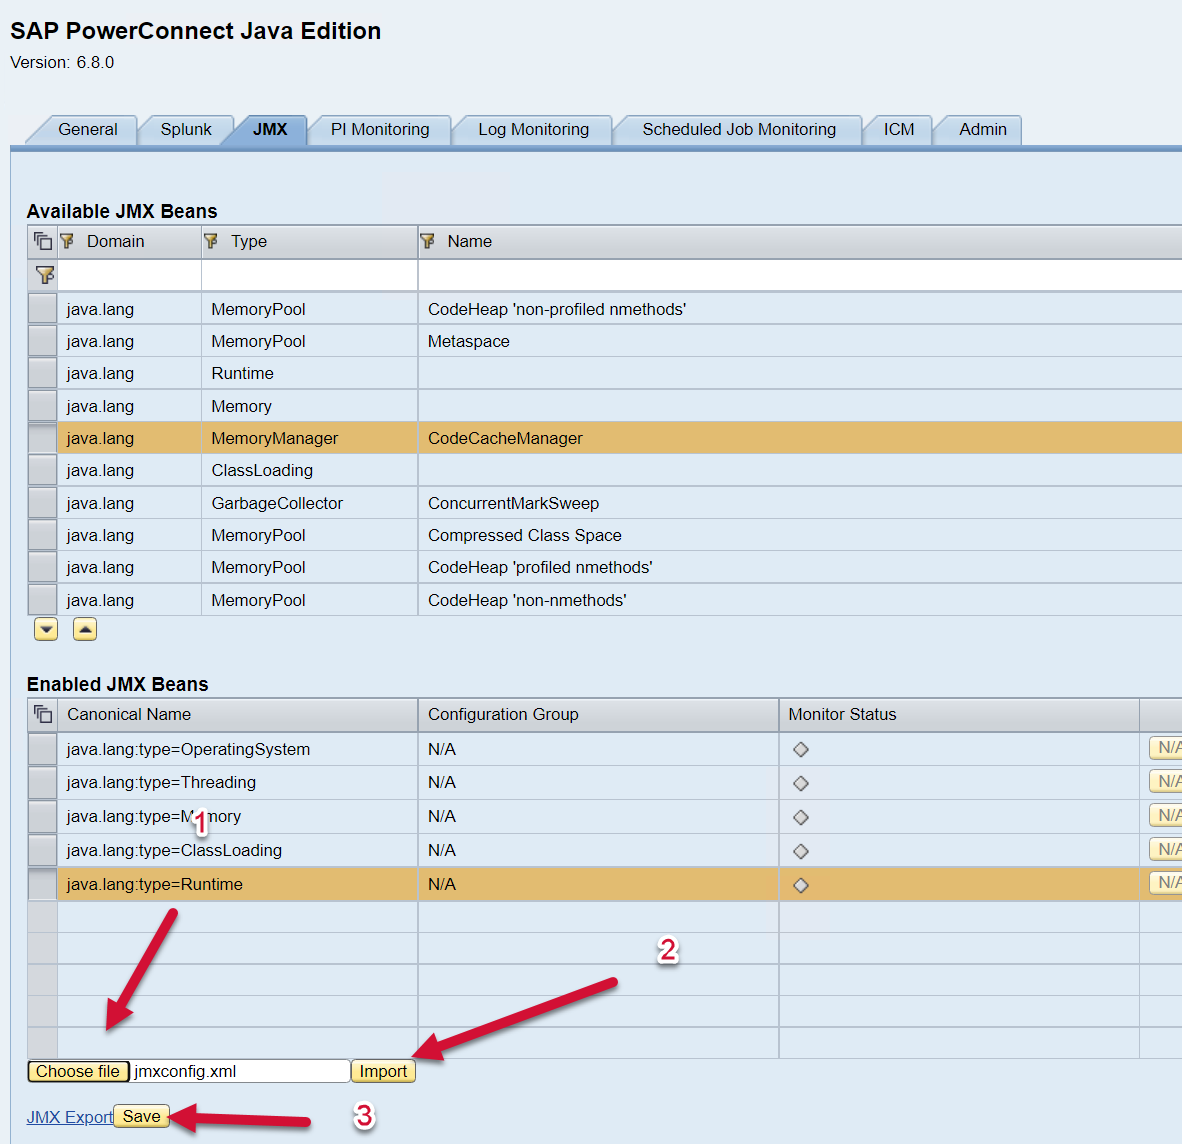
You will see a Popup Window display the message “Successfully imported JMX Configuration” and the Enabled JMX Beans table should be automatically updated to reflect the newly applied configuration.
JMX Bean Reference
Here are some useful MBeans with their fields and associated descriptions:
|
Name |
Field |
Description |
|---|---|---|
|
java.lang:type=OperatingSystem |
Arch |
System cpu architecture |
|
|
AvailableProcessors |
Number of cpu cores |
|
|
FreePhysicalMemorySize |
Free physical RAM on the host system |
|
|
CommittedVirtualMemorySize |
Used virtual memory |
|
|
FreeSwapSpaceSize |
Free swap space |
|
|
MaxFileDescriptorCount |
Maximum number of file descriptors available |
|
|
Name |
Operating System name |
|
|
ObjectName |
MBean name |
|
|
OpenFileDescriptorCount |
Used file descriptors |
|
|
ProcessCpuLoad |
Cpu load of the Java process |
|
|
ProcessCpuTime |
Cpu time of the Java proces |
|
|
SystemCpuLoad |
Cpu load of the host system |
|
|
SystemLoadAverage |
Cpu load average of the host system |
|
|
TotalPhysicalMemorySize |
Total physical RAM available on the host system |
|
|
Version |
Operating System version |
|
java.lang:type=MemoryPool,name=* |
Name |
Memory Pool Name |
|
|
ObjectName |
MBean name |
|
|
Usage.init |
Memory pool initial size |
|
|
Usage.committed |
Memory pool commit size |
|
|
Usage.used |
Memory pool used size |
|
|
Usage.max |
Memory pool maximum size |
|
|
Type |
Type of memory that the pool uses e.g. HEAP or NON_HEAP |
|
java.lang:type=Compilation |
Name |
Compiler name |
|
|
TotalCompilationTime |
The accumulated time the Java process has spent doing JIT compilation (milliseconds) |
|
java.lang:type=GarbageCollector,name=* |
Name |
Type of Garbage Collector configured e.g. Concurrent Mark Sweep |
|
|
CollectionCount |
Number of times the Garbage Collector has run since the Java process was started |
|
|
CollectionTime |
The accumulated time the Garbage Collector has run |
|
|
LastGCInfo.GcThreadCount |
Number of threads used to run the Garbage Collector |
|
|
LastGCInfo.duration |
How long the last Garbage Collector run took |
|
|
LastGCInfo.startTime |
Milliseconds since Java process was launched |
|
|
LastGCInfo.endTime |
Milliseconds since Java process was launched |
|
|
LastGCInfo.memoryUsageBeforeGc |
Information about the committed, initial, max and used memory before the Garbage Collection event |
|
|
LastGCInfo.memoryUsageAfterGc |
Information about the committed, initial, max and used memory after the Garbage Collection event |
|
java.lang:type=Runtime |
Name |
Process ID of the Java Process |
|
|
BootClassPath |
Boot Classpath of the Java process |
|
|
ClassPath |
Classpath of the Java process |
|
|
InputArguments |
Array of arguments with which the Java process was started |
|
|
SpecVersion |
Java version |
|
|
StartTime |
Time in Epoch format the Java process was started |
|
|
Uptime |
The number of milliseconds the Java process has been running |
|
|
SystemProperties |
Array of system properties with which the Java process was started |
|
java.lang:type=Threading |
DaemonThreadCount |
Number of daemon threads running |
|
|
ThreadCount |
Number of threads running currently |
|
|
PeakThreadCount |
Maximum number of threads running since the Java Process was started |
|
|
TotalStartedThreadCount |
Total number of threads started since the Java Process was started |
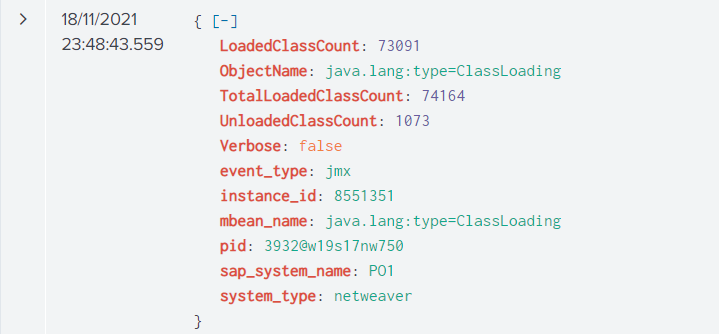
Splunk Event
Please note the fields displayed will vary depending on which Java MBean is selected. The event will look like this in Splunk: